
Introduction To Bartweb
Published:
This is a post on introducing the motivations and workflow of BARTweb which is my previous work at Zanglab. The BARTweb is now published in NAR Genomics and Bioinformatics and the BART family (e.g. BART software, BART3D, etc) has gained tremendous attentions with a news post on UVAToday.
Here, I would like to introduce a bit on what BARTweb can do and how it is contributing to genomics research. Feel free to refer to the Slides to get a better view of this web tool.
Why BART?
BART can be used to analyze Differentially Expressed Genes (DEG)
Traditional ways of doing downstream analysis on a bunch of differentially expressed genes are Gene Ontology analysis such as DAVID, or Pathway analysis such as KEGG. Both methods lack information in which TFs regulate the genes.
Conventional TF prediction methods are sequence-based
The most popular method of TF prediction is to scan motifs, which only values the promoter regions near the Transcription Start Site (TSS). In other word, it left out distal enhancers. Meanwhile, a sequence-based method engenders a problem that multiple factors may share similar motifs, increasing the chance of finding a wrong TF. Furthermore, a motif does not necessarily mean a binding.
That is what our BART and BARTweb can do - to predict functional regulatory TFs when given only a gene list, a ChIP-seq genomic binding profile or a genome region set. For more details about BART, please refer to the paper here.
Why BARTweb?
In BART, we leverage a large amount of H3K27ac and TF ChIP-seq public data to compute the cis-regulatory profiles, which occupy tremendous disk space and bring intensive computation load.
To release the burden of biomedical researchers from coding and downloading the datasets, we developed this web interface, named BARTweb, to run users’ jobs on our UVA Research computing cluster. In BARTweb, we have updated more available H3K27ac and TF ChIP-seq datasets (numbers are listed in the table) compared to when BART was released. In the meantime, we have optimized the algorithm to shorten the job execution time. Our new version can help reduce job running time from 1.5 hours to around 5-10 mins.
Table 1: the data size comparison between BART and BARTweb.
| H3K27ac samples | TF ChIP-seq dataset | TF counts | UDHS(UAC) | |
|---|---|---|---|---|
| BARTweb V1.1 | 366/267 | 7032/5023 | 883/531 | 2732010/1529448 |
| BARTweb V1.2 | 1230/737 | 7987/5887 | 1300/700 | 4157285/2687740 |
We are aiming to collect more up-to-date datasets and updating the information annually.
BARTweb workflow and examples
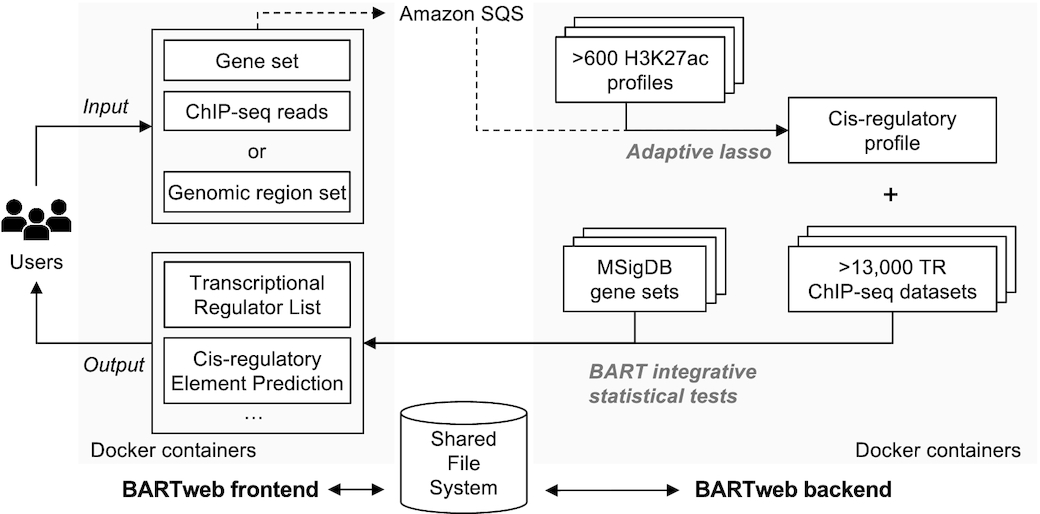
A simple workflow chart is attached here to intuitively illustrate how BARTweb works.
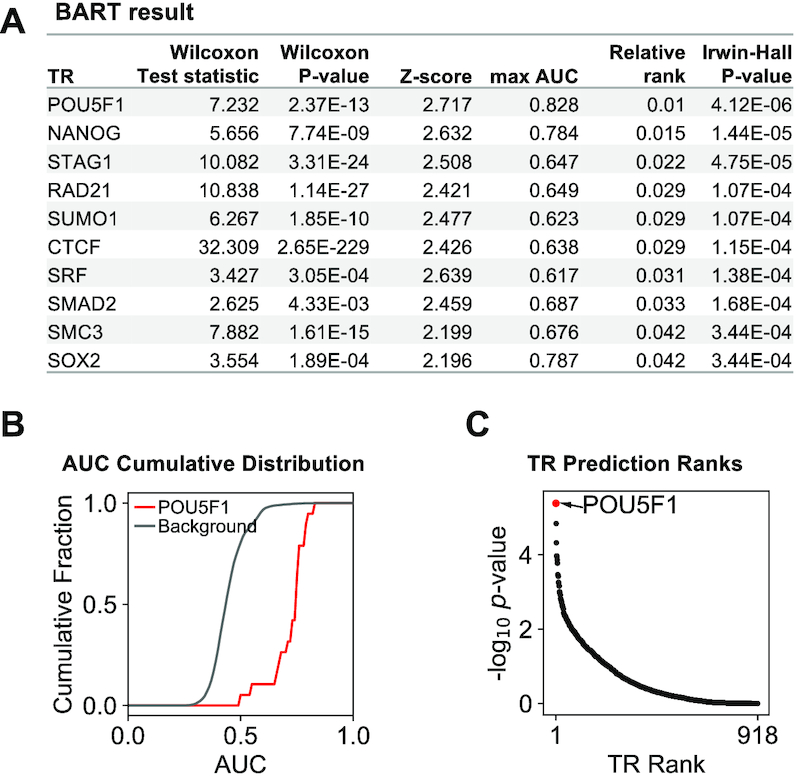
A sample output of a gene set downregulated upon OCT4 (POU5F1) knocked down in a human embryonic stem cell. More intepretations can be found at the help page of BARTweb.
Please feel free to try it out and I am looking forward to any comments!